![[PIMS Logo]](/gifs/pimssmall.gif)


|
|
|
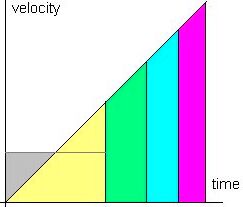
What portion of time does a stone spend in the middle third of its fall from the tower? Further down on this page, you'll get a chance to submit your answer. The yellow, green, blue, and purple areas on the right are equal in size, and therefore show the fall cut into quarters. Why areas? Think about it: the distance travelled in any time interval equals its duration times the average speed in it, and hence shows up as the area under the velocity graph over that interval. In free fall, velocity grows at a constant rate, and its graph is a straight line. |
|
In dealing with this problem, it does not matter what units we use: metres or feet, minutes or seconds. Here we have chosen them so that the entire fall takes one time unit, and the final velocity equals 1. The total distance fallen is therefore 1/2: the area of the coloured triangle. The middle third of the fall stretches from 1/6 to 2/6, and to answer the question, you need only find the times at which these distances (i.e., areas) occur.
|
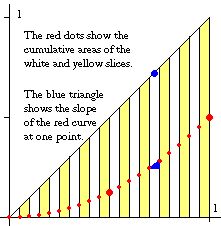
For further analysis, the diagram on the left shows time sliced into twentieths, and a red dot indicates the total distance fallen at the end of each slice. Of course, the slicing can be made even finer -- yielding more red dots -- and ideally ("in the limit", as we say) the red dots form a smooth curve, called the integral of the velocity graph. If we erased the latter, we could easily reconstruct it from the slopes of the red curve, as follows. Look at the little blue triangle stuck in one of the slices on the left. Its "rise" represents the vertical difference between two succesive red dots, i.e., the area contributed by that particular slice. Obviously this area equals the width of the slice (i.e., the horizontal "run") times its average height. The latter -- indicated by a blue dot -- therefore equals the slope (=rise/run) of the slanted side in the triangle. This quantity depends only on the red curve, but to nobody's surprise, the blue dot lies on the original velocity graph. If you did this in every slice, you would get a string of blue dots tracing out the straight line we started with. |
This logic works for just about any graph (not just a straight line). If we first integrate -- i.e., plot the cumulative areas of its slices -- and then differentiate -- i.e., plot the slopes along that "integral" curve -- we get back the original graph. This is the Fundamental Theorem of Calculus, the tip of an iceberg which has grown into a major feature of the mathematical landscape over the last 350 years. Its importance lies in relating a seemingly intractable process (integration) to a computationally straightforward one (differentiation). The dreaded difficulty of the subject comes from two sources: to clean up its logic (and avoid pitfalls), we need a good theory of limits; to extend it to higher dimensions, we need a strong geometrical foundation.
The Pacific Institute for the Mathematical Sciences (PIMS) is a non-profit organisation supported by five universities of Western Canada and dedicated to the promotion of mathematical research -- but it also has a programme of education and public awareness.
This contest is now over. The answer is [(2^.5)-1]/(3^.5) or 0.23914631. The winner of the draw was Russell Wierzba.
| © 2004
Pacific Institute for
the Mathematical Sciences Last Modified: Monday, 27-Aug-2001 17:13:28 PDT |